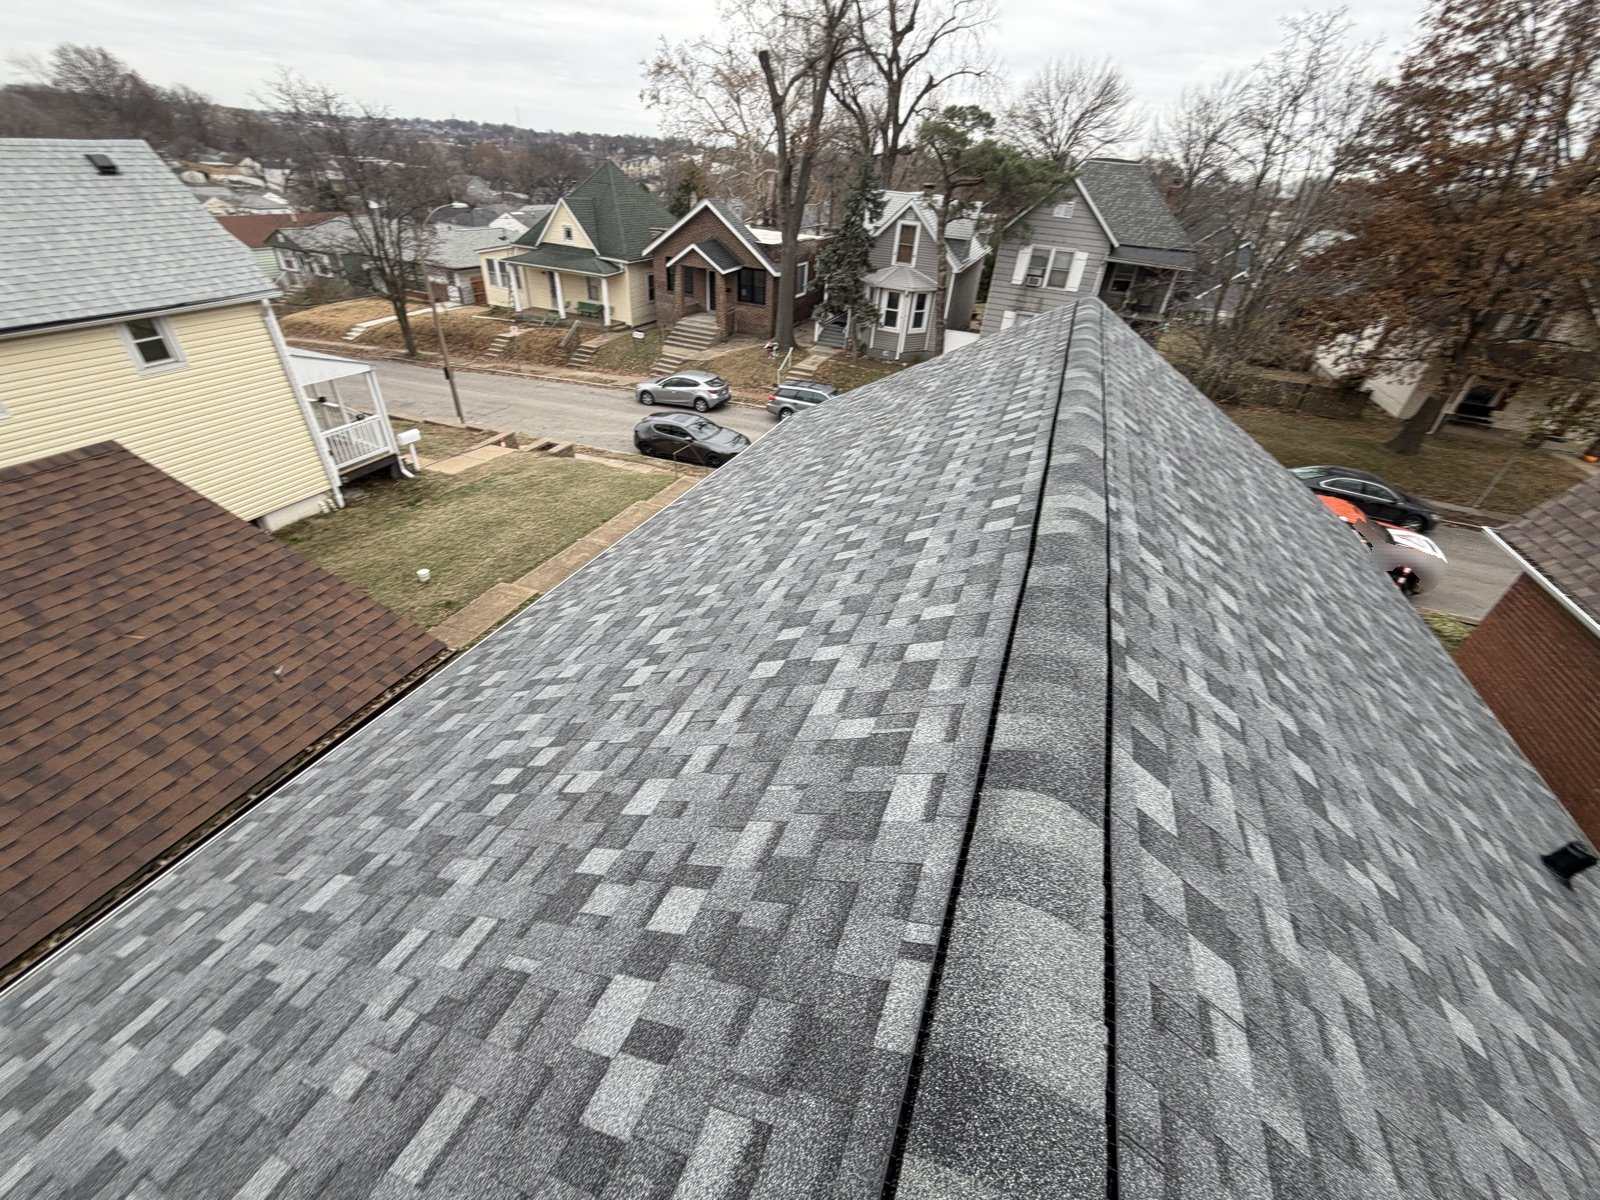
Malarkey shingles, installed / File 04
Hail in St. Louis County: the record
What was actually logged, by whom, and what those counts do and do not measure. With the unsourced figures currently circulating named as unsourced.
The counts
NOAA logged 125 hail events in this county
The National Oceanic and Atmospheric Administration keeps the Storm Events Database. For the years 2020 to 2025 it holds 125 hail events for St. Louis County, with a largest measured stone of 2.5 inches and an average across the reports of 1.32 inches. The surrounding counties are lighter.
| County | Logged events | Note |
|---|---|---|
| St. Louis County | 125 | Largest stone 2.5 inches, average 1.32 inches |
| St. Charles County | 54 | Fast growing population through the period |
| Jefferson County | 44 | Lower population density |
| Franklin County | 30 | Largely rural, fewest reporters |
Read this the right way
These are counts of reported events, not counts of insured losses and not a measure of how much hail fell. An event enters the database when a person or a trained spotter reports it, so reporting density tracks population. A county with a million residents generates more reports than a rural county receiving the same weather. Use the table for the shape of the risk, not as a scoreboard between counties.
The season
April and May carry most of it
Hail here is not spread evenly through the year. NOAA Storm Prediction Center climatology for this forecast area puts roughly 56 percent of the metro's annual hail reports in April and May. That concentration is why roofing in St. Louis has a rhythm: a quiet late winter, a violent spring, and then a summer of work being done on roofs that were damaged in a fortnight two months earlier.
It also explains a nuisance. The same fortnight brings out of state crews who arrive with a magnet for a canvassing route, work a season and leave. That is not an accusation against any particular company and there are competent travelling crews. It is a reason to ask where a contractor was working last November, and where they will be next November, before you sign anything.
The 2025 season
What the state and the weather service published
Two separate official records describe the 2025 season, and they are worth keeping separate from each other.
- Missouri DCI
- The Missouri Department of Commerce and Insurance reported 253,241 catastrophic claims arising from the 2025 season, with more than 2.9 billion dollars paid, roughly 83 percent of it residential. Published at insurance.mo.gov.
- May 16 2025 tornado
- The National Weather Service rated it EF3 with estimated winds of 152 miles per hour. It began near Clayton at 2:41 in the afternoon, ran a 22.6 mile path, and reached a maximum width of 1.8 miles, the widest in this region in the record that begins in 1950. Five people were killed. The damage figure of 1.6 billion dollars comes from NCEI, not from the weather service.
- FEMA DR-4877-MO
- The federal declaration covering St. Louis City and County recorded 9,427 individual assistance approvals, 58.13 million dollars in individual and household programme funds and 105.01 million dollars in public assistance.
- National ranking
- The Insurance Information Institute, citing NOAA's Storm Prediction Center, placed Missouri fifth nationally for major hail events in 2025, with 253 of them. Separately, State Farm ranked Missouri second among states for hail claim dollars paid. Those are two different measures from two different sources and they should never be merged into one sentence.
The bad numbers
Figures circulating locally with no source at all
Several numbers appear repeatedly on St. Louis roofing blogs and in canvassing scripts. We have looked for the sources and cannot find them, so this site will not repeat them and you should be sceptical when somebody does.
- A claim of "173,000 homeowners claims and 1.6 billion dollars" attributed to the Missouri Department of Commerce and Insurance. The department's own published season figures are the ones set out above, and they are not these.
- A claim of "five presidential disaster declarations in 2025, more than any other state".
- Missouri specific figures attributed to a well known catastrophe modelling firm, quoted without a report name or a date.
- An EF2 tornado said to have run through the north county suburbs in April 2026.
A number without a source is a decoration. If a roofer quotes one at your kitchen table, ask which agency published it and in what year, and watch what happens.
The practical consequence of this record is the reason the rest of this site exists. A metro that logs this much impact is a metro where a material's behaviour under impact is a fair question to ask, which is what the material page covers, and where the rating on the bundle is worth understanding properly rather than taking as a slogan, which is what the rating page covers.